Buying a Rental vs. Just Buying an index fund — How I Really Decide
Aug 17, 2025

When I bought my first rental, I thought it would be “buy → tenant → profit.” Reality: vacancy, repairs, taxes, insurance, closing costs, and the mortgage all want a slice. The trick isn’t fancy math—it’s being honest about money in and money out, then asking, “Does this beat an S&P-500/QQQ index fund with the same cash?”
What follows is U.S.-focused, beginner-friendly, and blunt. Simple tables, real numbers from the calculator, and a clean head-to-head with an index fund.
Try our: Rental Investment Calculator
1) The money map: where the rent actually goes
A rental is a little business. Rent comes in. Real costs go out. After the mortgage, what’s left is cash flow.
| Term | Plain English | Why it matters |
|---|---|---|
| Vacancy | Time your place sits empty | Lowers actual rent collected |
| Operating costs | Property tax, insurance, repairs/maintenance, HOA/manager, reserves | These hit before the mortgage |
| NOI | Effective rent (after vacancy) minus operating costs | The property’s engine (pre-debt) |
| Mortgage (P+I) | Principal + interest | Must be paid, good month or bad |
| Cash flow (pre-tax) | NOI – Mortgage | Money in your pocket (before taxes) |
2) Quick screeners (to avoid time-wasters)
Filters, not verdicts.
| Screener | What it is | How I use it | “Fail” smells like |
|---|---|---|---|
| 1% rule | Monthly rent ≈ 1% of price | Sanity check only | $600k home renting for $3k (0.5%) → probably thin/negative cash flow |
| 50% rule | ~50% of gross rent goes to ops (not the mortgage) | If it’s ugly before the mortgage, I pass | You need heroic rent to break even |
| DSCR ≥ 1.25 | NOI ÷ annual mortgage | Cushion for surprises | At ~1.0, one hiccup and you’re writing checks |
| Manager 8–12% | Of collected rent | Include it even if you plan to self-manage | Pretending your time is free |
| Depreciation | 27.5-yr on building only | Tax cushion, not a rescue plan | Using it to justify obviously bad deals |
3) The actual scenario (from the calculator defaults)
Property: $600,000 single-family rental Down payment: 20% ($120,000) → Loan: $480,000 at 6.5%, 30-yr One-time cash at purchase: closing $8,000 + initial CapEx $15,000 Starting rent: $3,000/mo (3% annual growth) Vacancy: 5% Ops costs: property tax 1.2% of value (reassessed annually), insurance $1,200/yr, maintenance 1% of value, CapEx reserve $2,000/yr, manager 8% of EGI Taxes: 24% ordinary, 15% LTCG, 25% recapture Hold: 20 years, sell cost 7%, no 1031 Appreciation: 5%/yr
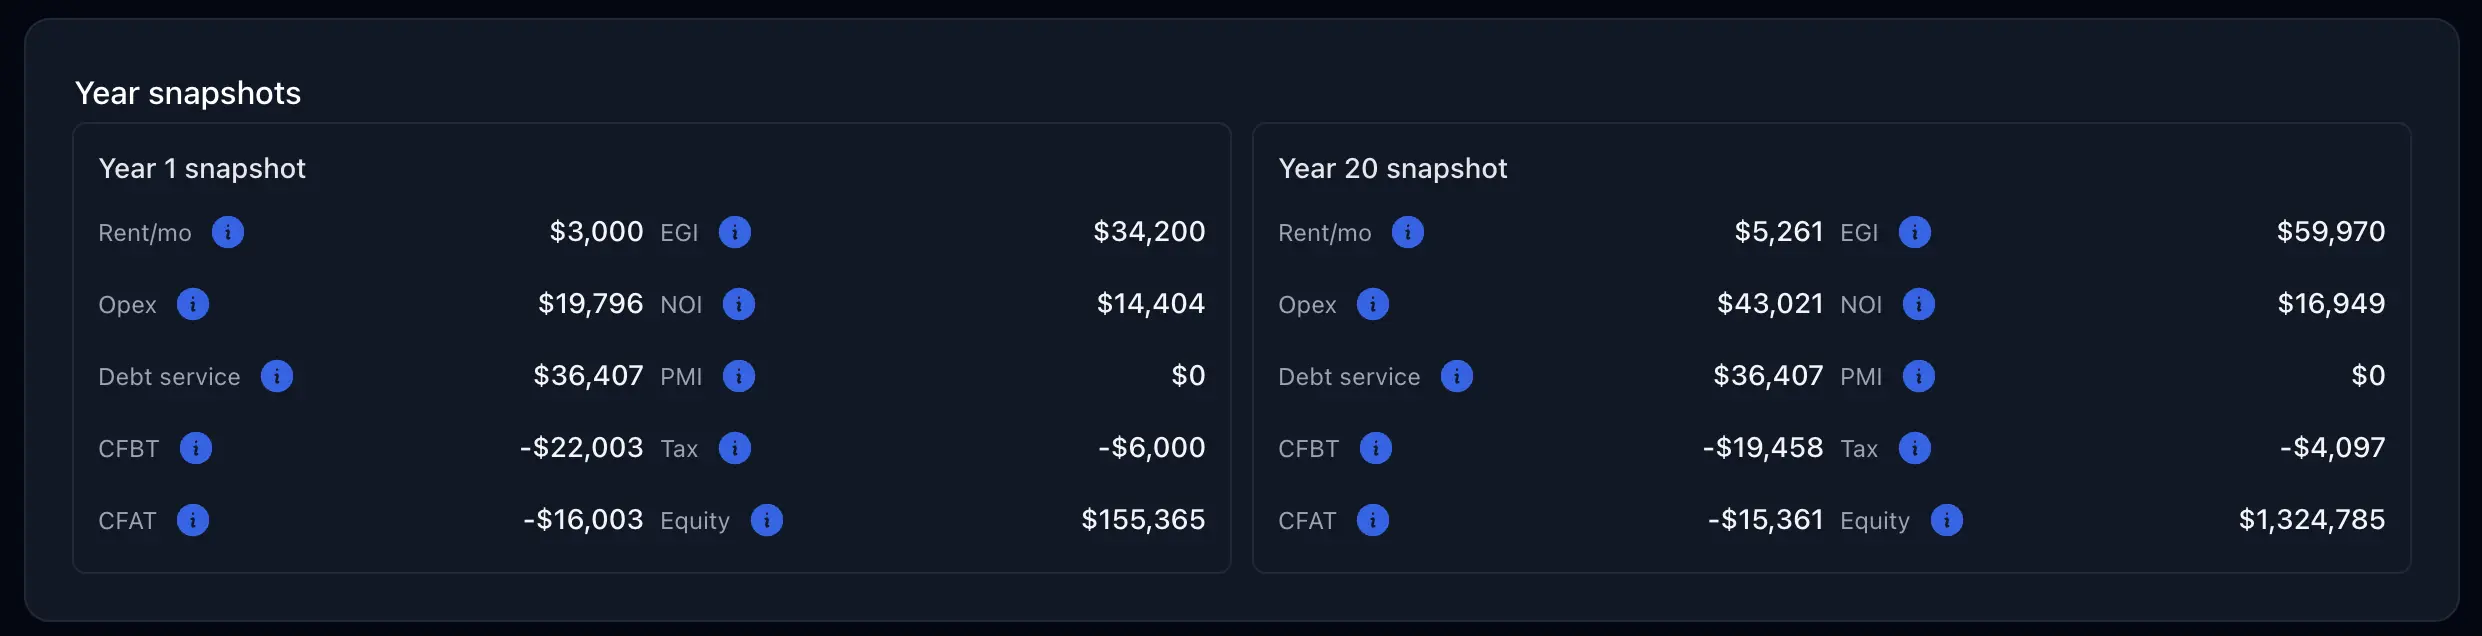
Year-1 (from the calculator)
- EGI (after 5% vacancy): $34,200
- Operating expenses: $19,796
- NOI: $14,404
- Debt service (P+I): $36,407
- Cash flow (before tax): –$22,003
- Cash flow (after tax): –$16,003 (depreciation helps, but you’re still negative)
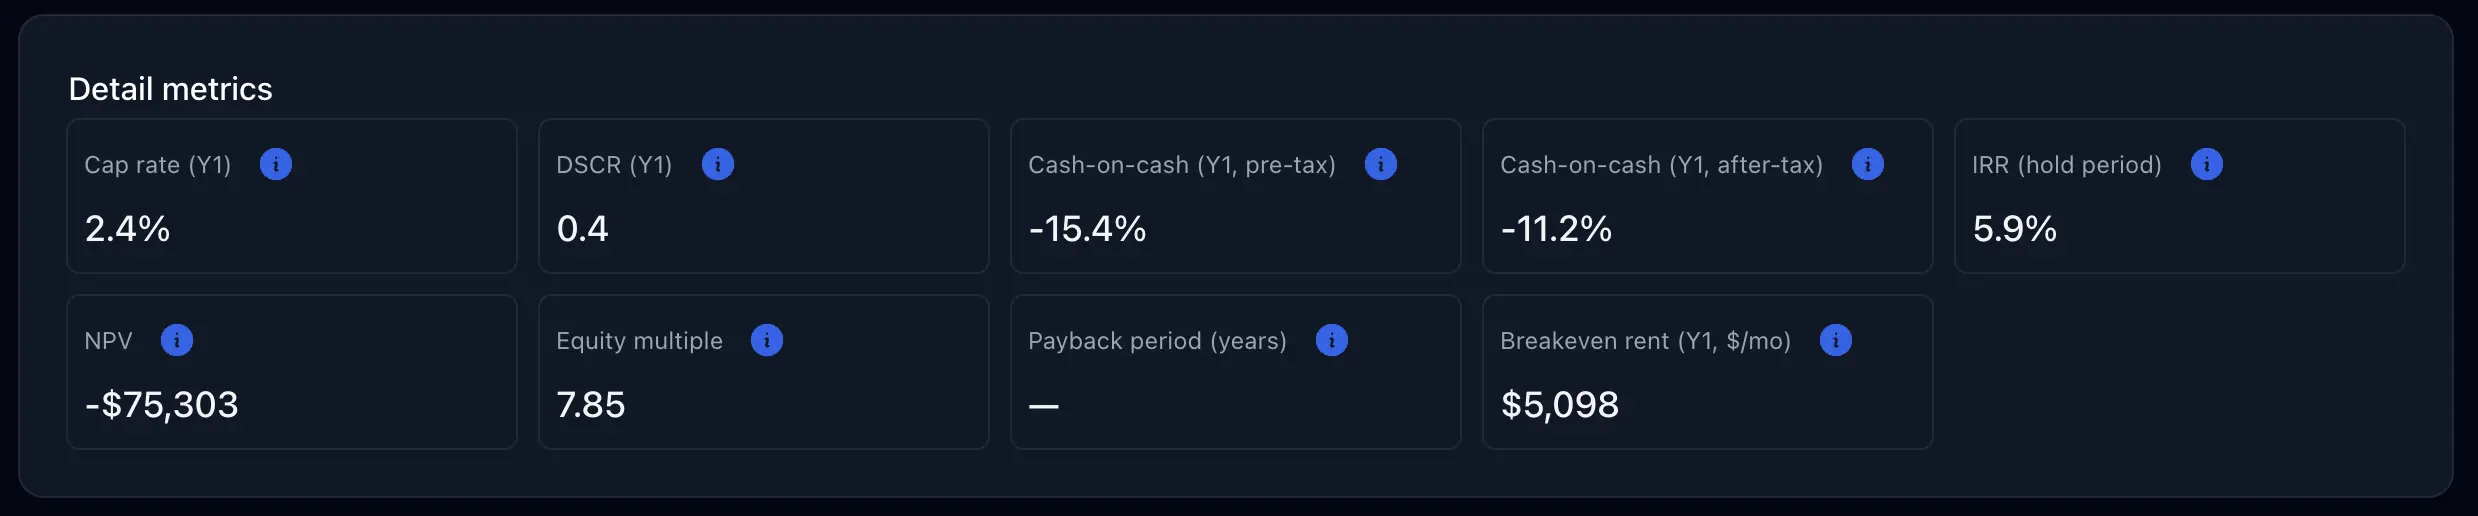
- Metrics: Cap rate 2.4% • DSCR 0.4 • Cash-on-cash –15.4% (pre-tax), –11.2% (after-tax)
- Breakeven rent (Y1): $5,098/mo (your $3,000/mo is nowhere close)
Translation: This deal bleeds cash. You’re betting on appreciation and loan paydown to bail you out.
Year-20 snapshot (still from the calculator)
- Rent/mo: $5,261
- EGI: $59,970
- NOI: $16,949
- Debt service: $36,407
- Cash flow after tax: –$15,361
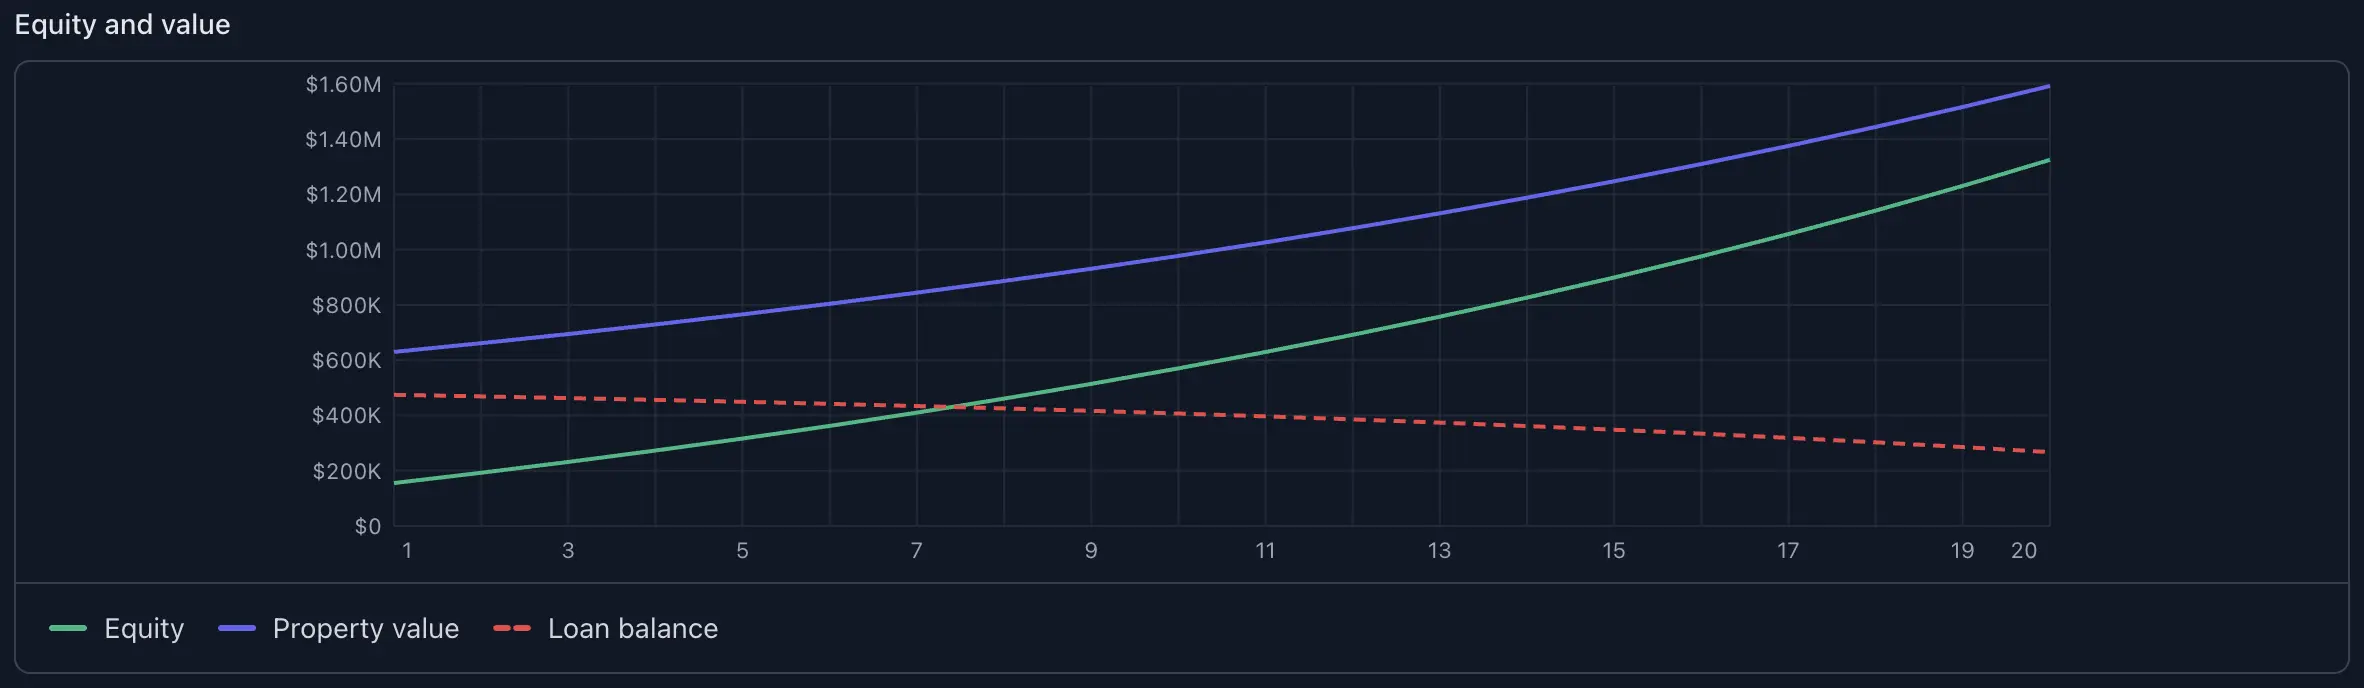
- Equity on paper: $1,324,785
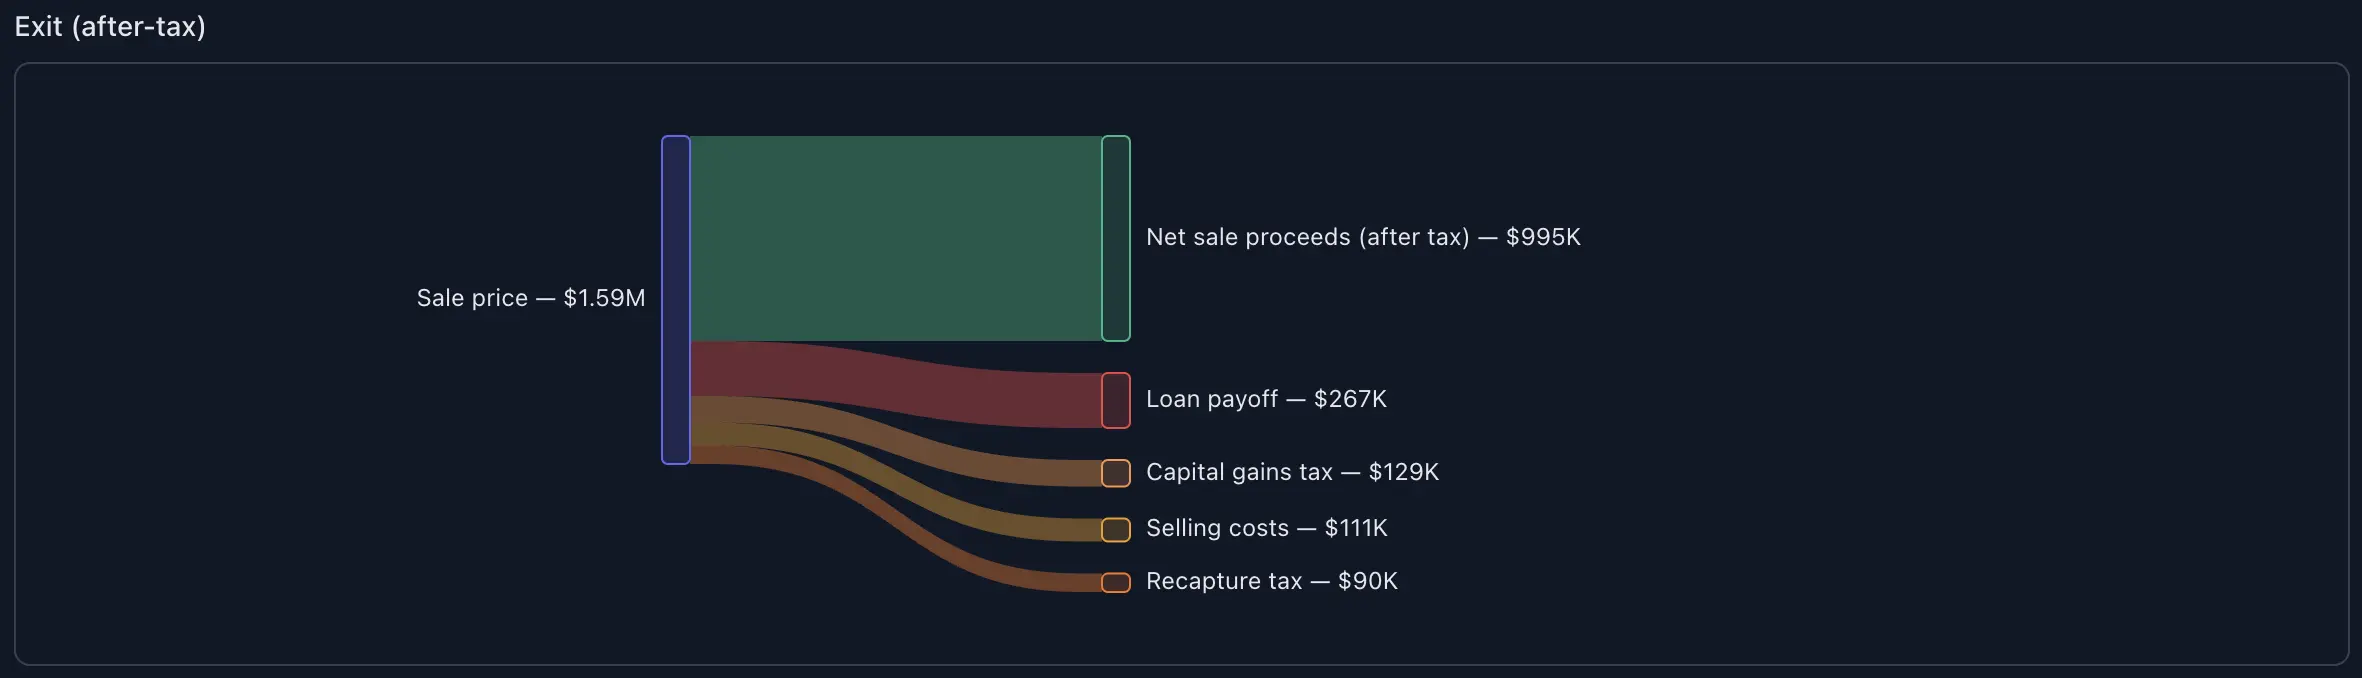
Exit at Year-20 (after-tax)
- Sale price: $1,591,979
- Costs & taxes: $111,439 (selling), $267,193 (loan payoff), $128,631 (cap gains tax), $90,000 (depreciation recapture)
- Net proceeds to you (after tax): $994,716
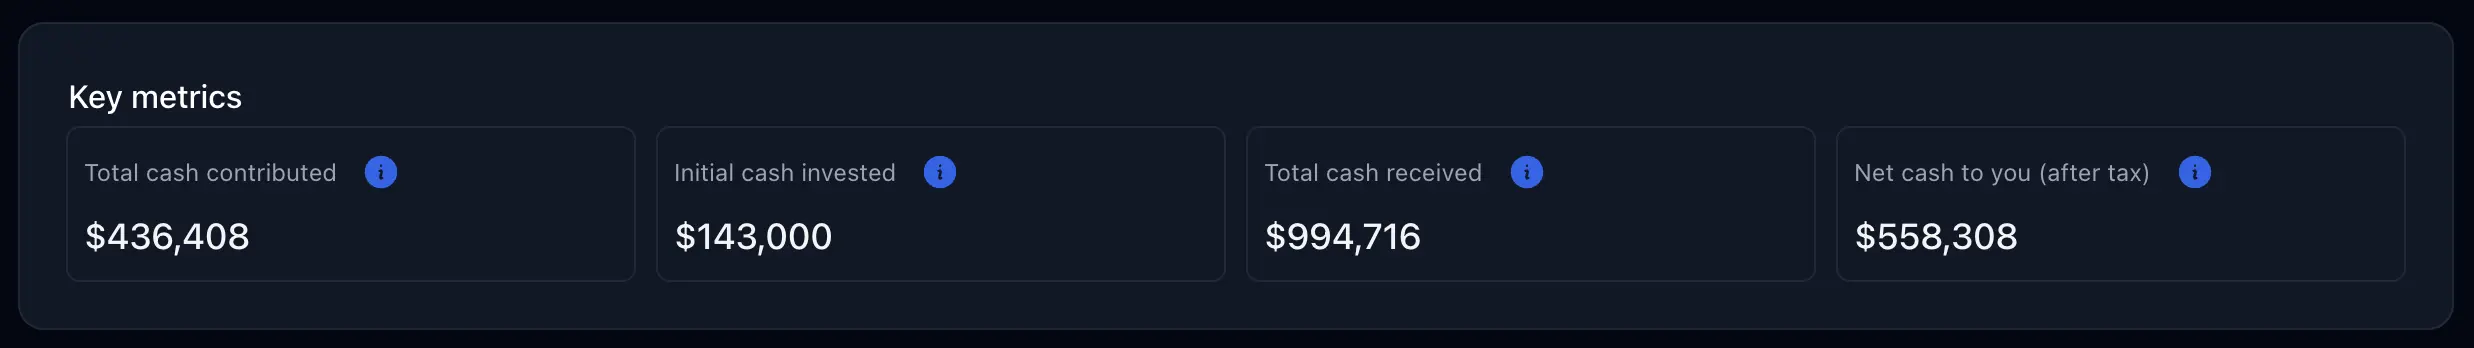
Cash in vs cash out (whole hold)
- Total cash contributed: $436,408
- Total cash received (sale, after tax): $994,716
- Net cash to you (after tax): $558,308
- Performance: IRR 5.9% • NPV –$75,303 • Equity multiple 7.85
Blunt read: 20 years of negative cash flow to end up with ~$558k net after tax. That’s fine only if the next best option is worse.
4) Same cash into an index fund (the calculator’s index side)
Using the same contribution pattern you pumped into the property (the tool matches cashflows) and QQQ (CAGR mode):
- Total contributions: $436,408
- Gross value: $4,661,715
- Capital-gains tax: $633,796
- Net value (after tax): $4,027,919
- Index IRR: 15.2%
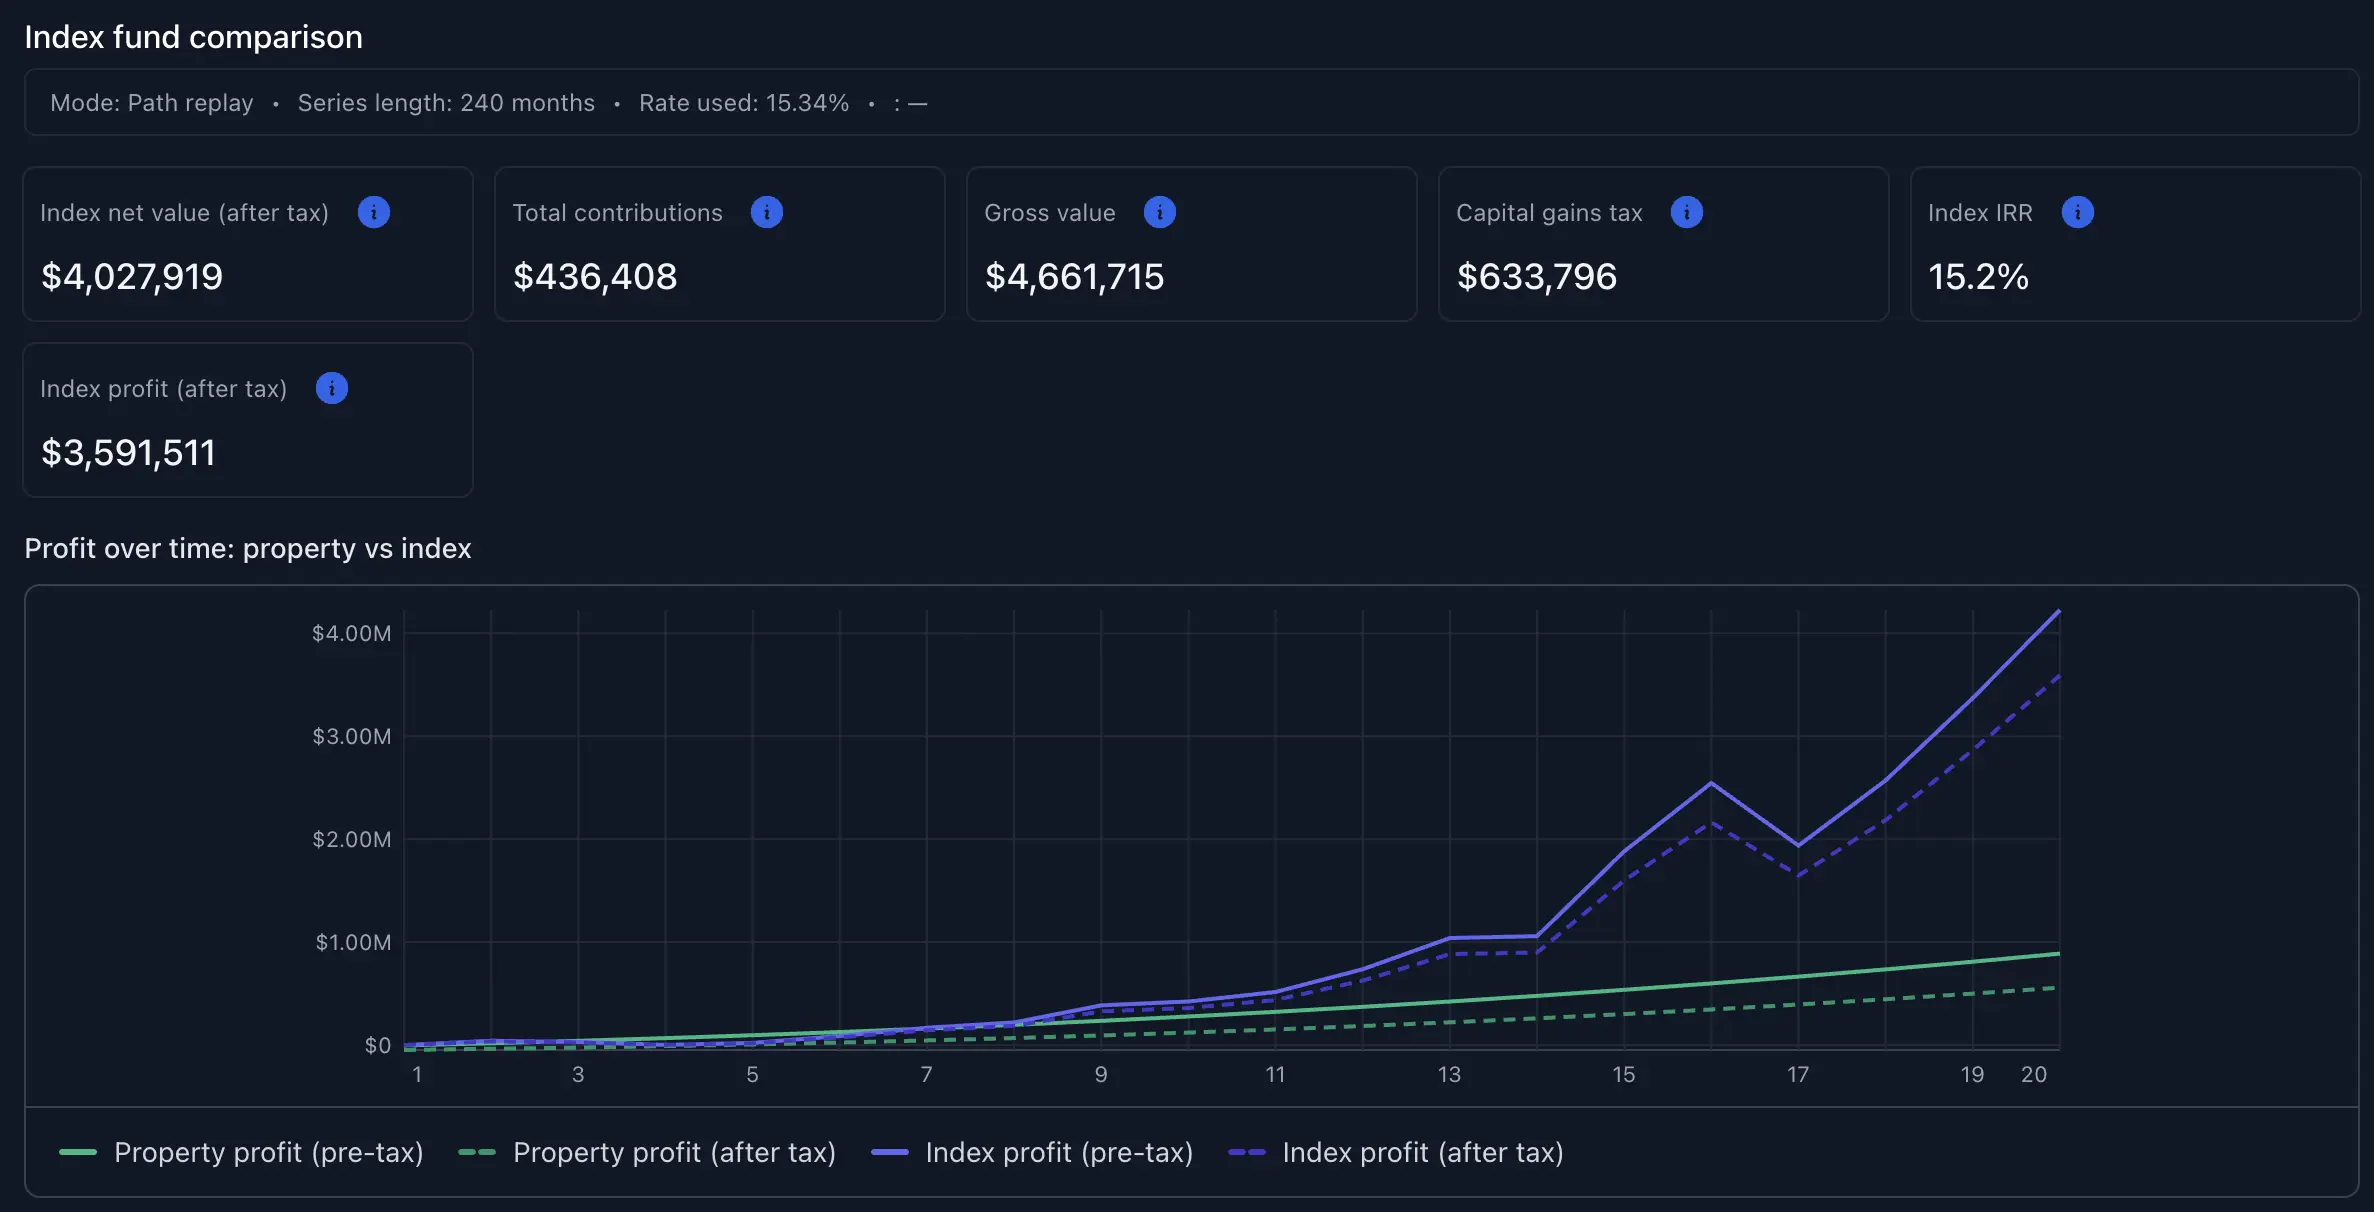
Result: Indexing crushes this deal: $4.03M after tax vs the rental’s $558k after tax. IRR 15.2% vs 5.9%. And the index didn’t call you at 2am about a leaking water heater.
5) Why this deal loses (and how to make one win)
- Rent-to-price is weak: $3,000 on $600k is 0.5%, miles below the 1% sanity check.
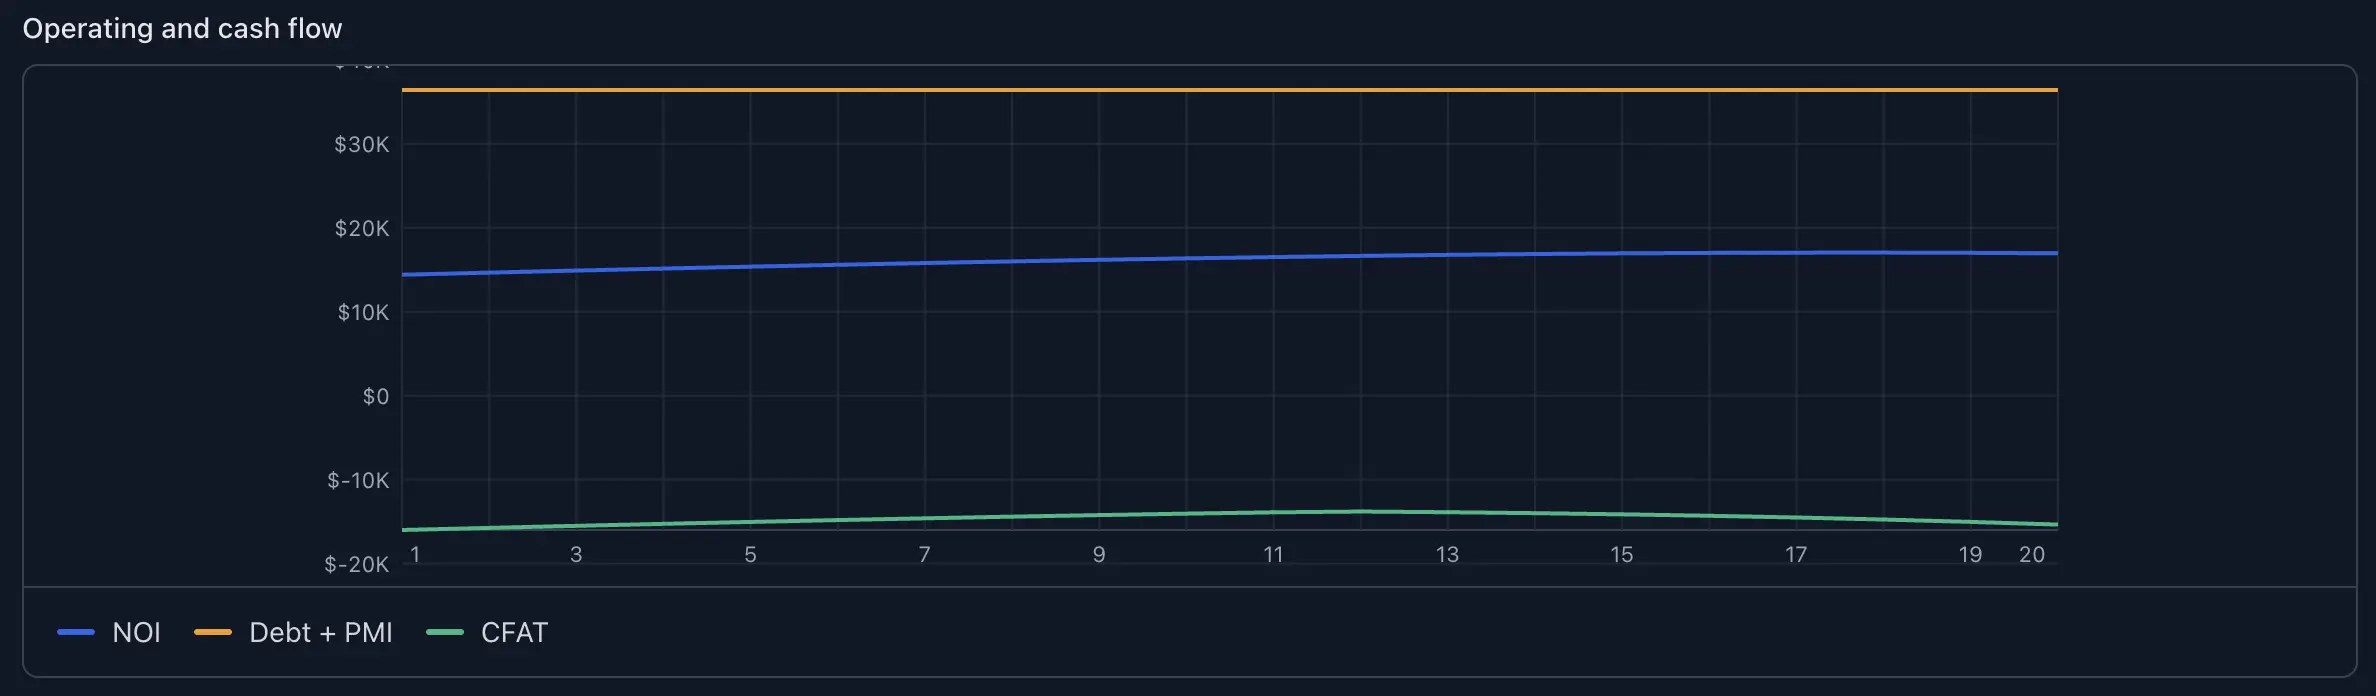
- Debt service dwarfs NOI: Y1 NOI $14.4k vs P+I $36.4k.
- Even by Year-20, you’re still negative CFAT. Appreciation helps equity, not monthly cash.
What would need to change?
- Rent for DSCR 1.25 (Y1): ≈ $5,728/mo (calculates from Y1 expense structure).
- Lower price or bigger down payment: Cuts debt service; improves DSCR and cash flow.
- Lower taxes/insurance/maintenance: Markets vary; some counties/HOAs kill deals.
- Cheaper rate or interest-only period: Rate matters more than most people admit.
- Actual value-add plan: Renovate → higher, defensible rent. Without it, you’re just hoping.
Until at least two of those move in your favor, this is an index-beats-rental scenario.
6) Taxes (short and real)
- Deductible: operating costs + mortgage interest.
- Depreciation: 27.5-yr on building can soften taxes, but won’t turn a structurally bad deal into a good one.
- Sale: expect recapture and capital gains unless you do a proper 1031. (Talk to a pro for your specifics.)
7) My decision checklist (applied to this deal)
- Screen fast: 1% rule fails hard.
- Pull real numbers: Done—tax, insurance, maintenance, manager, reserves.
- Run Y1: DSCR 0.4, CFAT negative → fail.
- Look 5–20 yrs out: Still negative CFAT; all upside is appreciation + amortization.
- Compare to index: Index wins by a mile here. I pass.
8) Want to rerun with your market?
Use the Rental Investment Calculator to tweak price, rent, taxes, rate, down payment, and hold period. It recomputes cash flow, DSCR, cap rate, cash-on-cash, and a full after-tax exit—plus a side-by-side index path so you can decide with your eyes open.
Try it: Rental Investment Calculator
Drop these images in the placeholders above for context:
- Year snapshots (Y1/Y20)
- Detail metrics
- Operating & cash-flow chart
- Equity & value chart
- Sale summary + Exit sankey
- Index fund comparison
- Key metrics
Educational only—no tax or legal advice. The whole point is clarity: if the rental’s real IRR (after tax, including sale) doesn’t beat a low-cost index fund by a comfortable margin, skip it. If it does—and the DSCR/cash flow aren’t lies—go be a landlord with eyes open.