Mag-7 Fans, Meet Your Upgrade: The Top-10 ETF
Aug 8, 2025
It’s time for a Top-10 ETF
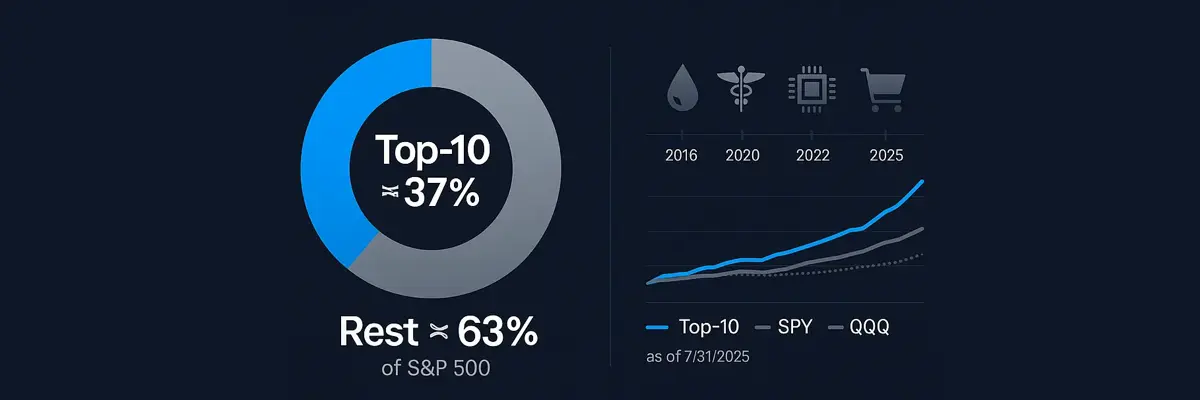
If all you did for the past decade was own the ten biggest companies in the S&P 500, you’d be sitting pretty. A simple $10,000 in a “Top-10 S&P” sleeve — rebalanced to always hold the current ten largest names — would be about $62,331today. The same $10,000 in the broad S&P 500? $35,981. Even the tech-heavy QQQ lands a notch lower at $55,621. That’s not a knock on SPY or QQQ; it’s just what happens when the market’s gains keep clustering at the very top.
This concentration isn’t a blip. Roughly a third-plus of the S&P 500’s value now sits in its ten biggest companies, and those companies have done the heavy lifting across 1, 3, 5, and 10-year windows. The S&P actually maintains a benchmark for this exact idea — the S&P 500 Top 10 Index (SP5T1) — and its trailing annualized returns as of July 31, 2025 are eye-opening:
- 1Y: 34.60%
- 3Y: 26.33%
- 5Y: 20.35%
- 10Y: 20.08%
And yes, today’s Top-10 includes the Magnificent Seven — NVIDIA, Microsoft, Apple, Amazon, Alphabet, Meta, Tesla — plus Broadcom, Berkshire Hathaway, and Walmart. That “plus three” actually strengthens the mix: Broadcom is the picks-and-shovels winner of the AI build-out, Berkshire smooths the ride with world-class capital allocation, and Walmart brings durable retail + ads + e-commerce scale. Crucially, this approach is dynamic. No guessing which theme stays hot; every rebalance you simply own the current top ten by size.
That’s the whole pitch: a plain, rules-based way to bottle the S&P’s engine — one that has outperformed broad beta in recent years and keeps up with (or beats) the flashier tech tilts — while naturally adapting as new giants emerge. Read on for the side-by-side numbers, how this stacks up against SPY/QQQ/XLG/RSP, who’s in the Top-10 right now (by company, not by ticker), and how a sponsor can launch this cleanly under today’s rules.
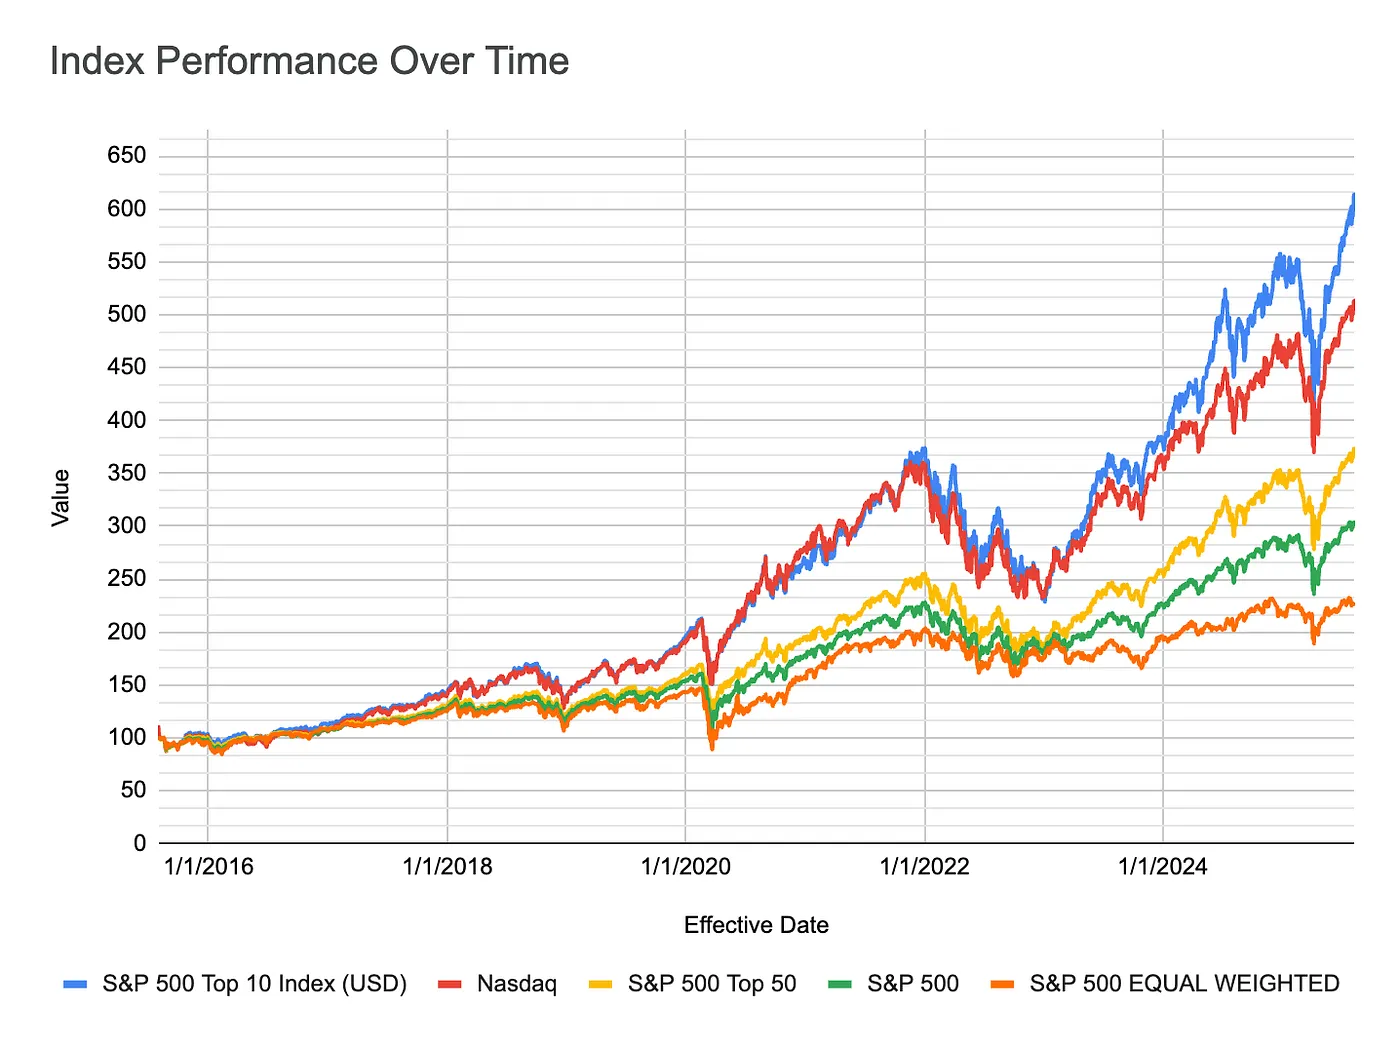
The performance case
You gave us SP5T1’s trailing annualized returns; we set all comparisons to the same date (7/31/2025) using each provider’s month-end numbers. We look at the following ETFs and compared them to S&P 500 Top 10 Index.
- SPX via SPY (S&P 500): The core market barometer.
- QQQ: Tech-heavy, phenomenal decade — but not S&P-pure and still broader than the top echelon.
- XLG: Top-50 S&P names — helpful, but dilutes the exact leaders vs. a Top-10.
- RSP: Equal-weight S&P 500 — a useful counterweight, but it has lagged in a mega-cap-led regime.
Annualized returns (%)
| Index / ETF | 1Y | 3Y | 5Y | 10Y |
|---|---|---|---|---|
| S&P 500 Top 10 (SP5T1) | 34.60 | 26.33 | 20.35 | 20.08 |
| S&P 500 (SPX) | 16.33 | 17.10 | 15.88 | 13.66 |
| Invesco QQQ (QQQ) | 15.82 | 26.17 | 18.12 | 18.72 |
| Invesco S&P 500 Top 50 (XLG) | 14.86 | 23.29 | 18.21 | 15.64 |
| Invesco S&P 500 Equal Weight (RSP) | 8.95 | 10.02 | 13.53 | 10.70 |
Sources: S&P Dow Jones Indices for SP5T1; State Street (SPX via SPY) as of 7/31/25; Invesco (QQQ, XLG, RSP) as of 6/30–7/31/25, using the provider’s month-end tables. (S&P Global, SSGA, Invesco, Schwab Wall Street)
Cumulative total returns (%)
| Index / ETF | 1Y | 3Y | 5Y | 10Y |
|---|---|---|---|---|
| S&P 500 Top 10 (SP5T1) | 34.60 | 101.61 | 152.48 | 523.31 |
| S&P 500 (SPX) | 16.33 | 60.57 | 108.95 | 259.81 |
| Invesco QQQ (QQQ) | 15.82 | 100.85 | 129.94 | 456.21 |
| Invesco S&P 500 Top 50 (XLG) | 14.86 | 87.41 | 130.82 | 327.64 |
| Invesco S&P 500 Equal Weight (RSP) | 8.95 | 33.17 | 88.60 | 176.36 |
Takeaway: Over every horizon shown—1, 3, 5, and 10 years—SP5T1 leads. Even against QQQ’s tech-tilt, the Top-10 basket edges it out at 3, 5, and 10 years, with a notably higher 1-year pop. That’s exactly the behaviour you’d expect in a market where gains are disproportionately driven by the largest platforms. (S&P Global, SSGA, Invesco)
“Mag-7… plus three” (and why that’s smarter than a static Mag-7 fund)
A true Top-10 fund would naturally include the Magnificent 7 (NVIDIA, Microsoft, Apple, Amazon, Alphabet, Meta, Tesla) and—right now—Broadcom, Berkshire Hathaway, and Walmart. That trio actually makes the portfolio healthier:
- Broadcom has ripped on AI infrastructure demand and the VMware integration, joining the true mega-cap tier in 2023–25. (Investors)
- Berkshire Hathaway is a capital-allocation machine with fortress insurance and a cash pile that smooths the ride; it’s printed record operating profits in the past year. (Reuters)
- Walmart is no longer “just a store”—e-commerce, membership, and advertising have driven steady share gains and record results. (Reuters, Digital Commerce 360)
A “Mag-7” ETF (like QTOP in Nasdaq-space or products that lean on that theme) is fun, but it’s not dynamic. A Top-10 by market cap refreshes automatically at each rebalance as leadership rotates—today it pulls in Broadcom/Walmart; in a different regime it could lean more into healthcare or financials. That’s exactly the point. (BlackRock)
Current Top-10 by company (Alphabet combined) and indicative weights
Using current mega-cap market caps (8/8/2025) and consolidating Alphabet’s two share classes into a single company, here’s what a company-level Top-10 looks like and their approximate shares within the Top-10 basket (market-cap-weighted):
| Company (by issuer) | Approx. weight inside Top-10 |
|---|---|
| NVIDIA | ~19.5% |
| Microsoft | ~17.0% |
| Apple | ~14.9% |
| Alphabet (A+C combined) | ~10.7% |
| Amazon | ~10.4% |
| Meta | ~8.5% |
| Broadcom | ~6.3% |
| Tesla | ~4.7% |
| Berkshire Hathaway | ~4.4% |
| Walmart | ~3.6% |
Built from year-to-date market-cap ranks as of Aug 8, 2025 (see “Top-10 by year” source). This is a company-level look; the official SP5T1 index holds Alphabet’s A and C lines separately and weights by float-adjusted market cap.
Top-10 companies by year (company-level, 2016–2025)
A rolling 10-year snapshot shows exactly how leadership evolved. (All as of year-end unless noted on the source page; Alphabet lines consolidated to one “Alphabet”.)
| Year | Top-10 constituents (alphabet classes combined) |
|---|---|
| 2016 | Apple, Alphabet, Microsoft, Berkshire Hathaway, Exxon Mobil, Amazon, Meta (Facebook), Johnson & Johnson, JPMorgan Chase, Wells Fargo |
| 2017 | Apple, Alphabet, Microsoft, Amazon, Meta (Facebook), Berkshire Hathaway, Johnson & Johnson, JPMorgan Chase, Exxon Mobil, Bank of America |
| 2018 | Microsoft, Apple, Amazon, Alphabet, Berkshire Hathaway, Meta (Facebook), Johnson & Johnson, JPMorgan Chase, Visa, Exxon Mobil |
| 2019 | Apple, Microsoft, Alphabet, Amazon, Meta (Facebook), Berkshire Hathaway, JPMorgan Chase, Visa, Johnson & Johnson, Walmart |
| 2020 | Apple, Microsoft, Amazon, Alphabet, Meta (Facebook), Tesla, Berkshire Hathaway, Visa, Johnson & Johnson, Walmart |
| 2021 | Apple, Microsoft, Alphabet, Amazon, Tesla, Meta, NVIDIA, Berkshire Hathaway, UnitedHealth, JPMorgan Chase |
| 2022 | Apple, Microsoft, Alphabet, Amazon, Berkshire Hathaway, UnitedHealth, Johnson & Johnson, Exxon Mobil, Visa, JPMorgan Chase |
| 2023 | Apple, Microsoft, Alphabet, Amazon, NVIDIA, Meta, Tesla, Berkshire Hathaway, Eli Lilly, Visa |
| 2024 | Apple, NVIDIA, Microsoft, Alphabet, Amazon, Meta, Tesla, Broadcom, Berkshire Hathaway, Eli Lilly |
| 2025* | NVIDIA, Microsoft, Apple, Alphabet, Amazon, Meta, Broadcom, Tesla, Berkshire Hathaway, Walmart |
*2025 list as of Aug 8, 2025.
This table shows how a Top-10 strategy adapts:
- Big Oil (Exxon) mattered in 2016–2019
- Healthcare leaders (UnitedHealth, Eli Lilly) broke into the top tier during 2021–2024
- Broadcom and Walmart appear in 2024–2025 as AI infrastructure and retail platforms scaled.
What about existing “big-stock” ETFs?
BlackRock launched TOPT (Top 20 U.S. Stocks—largest S&P 500 constituents) and QTOP (Top 30 within the Nasdaq 100). They validate the core idea, but they’re not the same thing: TOPT is Top 20, not Top 10, and QTOP is Nasdaq-only. A true SP5T1 tracker is tighter and index-pure to the S&P 500. (BlackRock)
Why this makes sense now
- Concentration is the feature, not a bug. The top 10’s index share is near records (~37%), and SP5T1’s performance premium over SPX and equal-weight has persisted across 1, 3, 5, and 10 years. (Reuters, SSGA)
- Dynamic by design. Unlike a static “Mag-7” sleeve, Top-10 automatically rotates newcomers (Broadcom) and secular winners (Eli Lilly, Walmart, UnitedHealth in certain years).
- Clear use-case. Investors already barbell SPY/VOO with QQQ or mega-cap funds (e.g., XLG). A simple, rules-based Top-10 ETF lets them lean harder into the actual market drivers—no stock picking required. And the last decade suggests the tilt has been well-compensated.
Bottom line
If your goal is to capture where value and profits are concentrating, a Top-10 S&P 500 ETF is the cleanest, most logical tool—and the data backs it up across 1, 3, 5, and 10 years. Someone should launch it. If you stick to SP5T1’s methodology (or a transparent company-level variant) and the 6c-11 ETF framework, you’re aligned with current rules—and you’re giving investors exactly what this market has been rewarding. (S&P Global)
Notes & sources:
- SP5T1 definition/overview: S&P Dow Jones Indices. (S&P Global)
- SPX returns (for 1/3/5/10-yr, 7/31/25): SPDR SPY month-end page. (SSGA)
- QQQ returns (6/30/25 factsheet, used for 1/3/5/10-yr): Invesco. (Invesco)
- XLG context/returns (June–July 2025): Invesco XLG materials & Schwab fund report. (Invesco, Schwab Wall Street)
- RSP returns (index table on product page, 7/31/25): Invesco RSP. (Invesco)
- Concentration stats: Reuters (top-10 ≈37% of SPX; Nvidia near 8%). (Reuters)
- TOPT & QTOP product pages: iShares. (BlackRock)
- Year-by-year Top-20 lists (used to show Top-10 by year & current market-cap ranks): FinHacker compilation (with primary data references).
- Company context: Broadcom strength; Berkshire record operating profit; Walmart outlook and e-commerce growth. (Investors, Reuters, Digital Commerce 360)
Standard reminder: past performance ≠ future results. Concentrated strategies can cut both ways. But if you believe the mega-cap flywheel still spins, packaging it cleanly as a Top-10 S&P 500 ETF finally gives investors the precise tool the market regime seems to demand.