Set it, contribute, don’t blink: how patience beats timing games
Sep 7, 2025

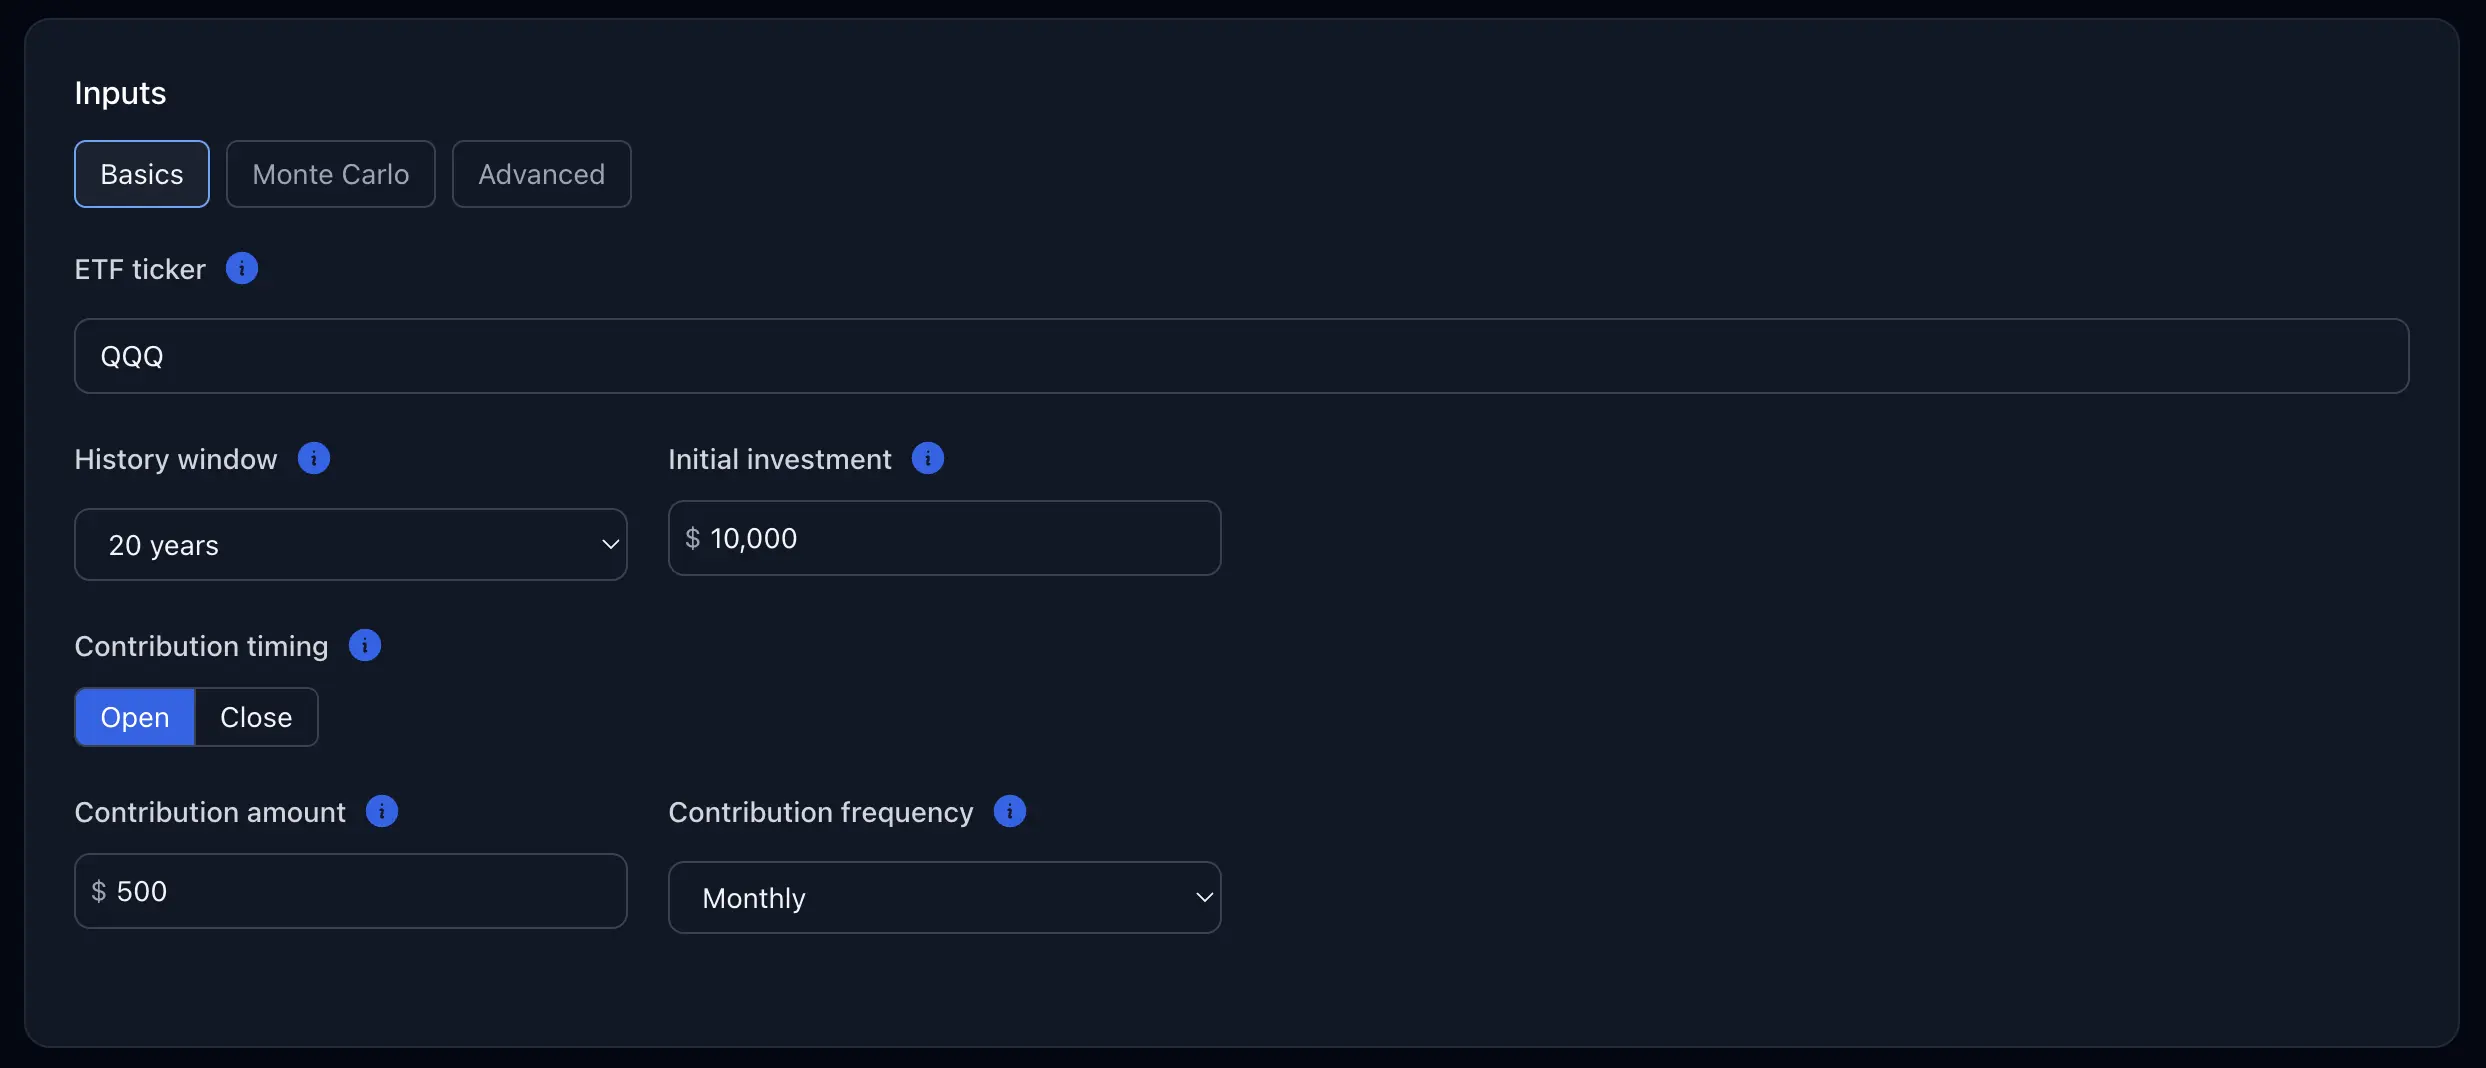
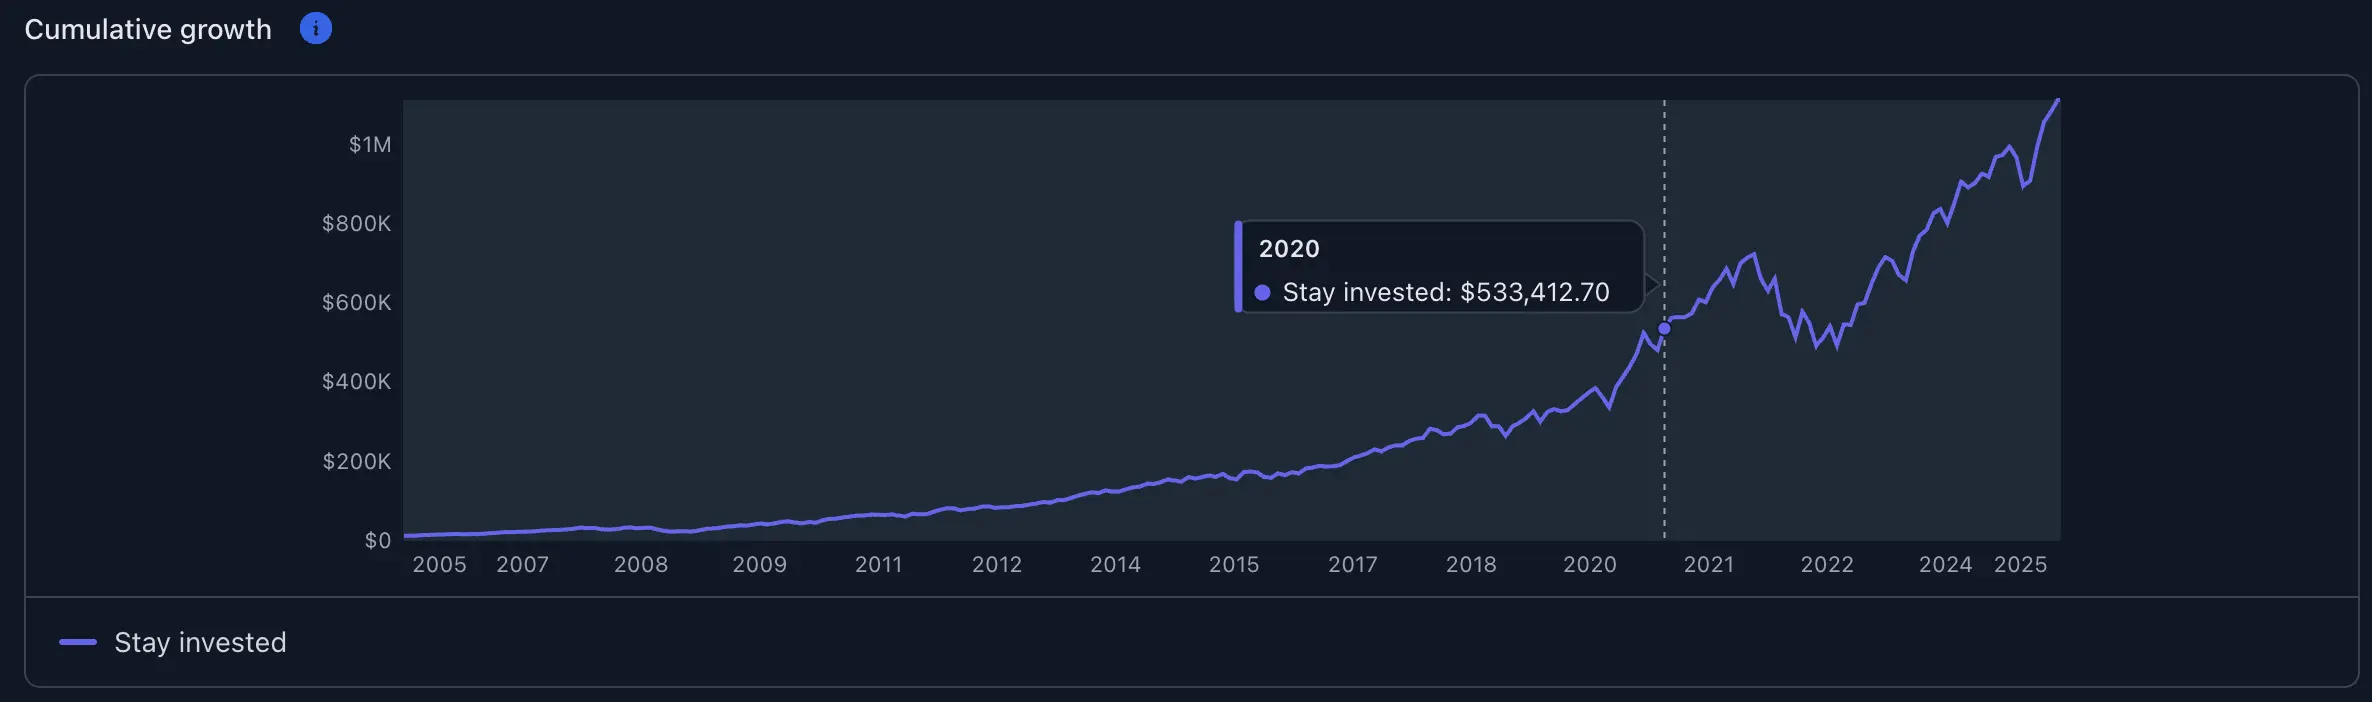
I used to think I could jump out when things looked shaky and hop back in for the rebound. So I built a simple-but-serious calculator to test that idea for one concrete setup: QQQ, 20 years, $10,000 to start, and $500 every month. The screenshot below are from that exact run. What surprised me wasn’t that timing is hard—it’s how small the “misses” have to be to do big damage. Miss a handful of the best days and your end balance takes a hit you’ll feel for years.
What we’re testing (so you can mirror it)
| Input | Setting I used | Why I chose it |
|---|---|---|
| ETF | QQQ | Clear tech-heavy growth benchmark people actually buy |
| Window | 20 years | Long enough to include booms, busts, rebounds |
| Initial investment | $10,000 | Round number; easy to eyeball |
| Contributions | $500/month at market open | Earlier in the day compounds longer |
| Dividends mode | Total return (on) | Dividends matter; use adjusted prices |
| Out-of-market (missed days) | 0% | Cash sits still; this is honest |
| Inflation | Nominal | You can toggle Real (CPI) if you want |
| Fees & trade costs | 0 bps (for clarity) | Add your fund’s ER later to see drag |
| Day selection | Global top | The classic “best N days” analysis |
(If you want to play with it: fiscademy.com/calculator/stay-invested.)
Where the money comes from (and goes)
Cash flow = what comes in − what goes out. Then it compounds.
| Piece | Plain-English meaning | Why it matters |
|---|---|---|
| Starting $10k | Your seed | Sets the base for compounding |
| $500/month x 20y | $120k of fresh cash | Total put in = $130k ($10k + $120k) |
| Daily returns (total return) | Price + dividends | Captures the powerful up-days |
| Missed best days | Days you weren’t in the market | Deletes the biggest boosts |
| Cash return while out | Set to 0% here | Doesn’t offset missing +3–5% bursts |
| Fees (bps) | Annual drag | Small %, real dollars over time |
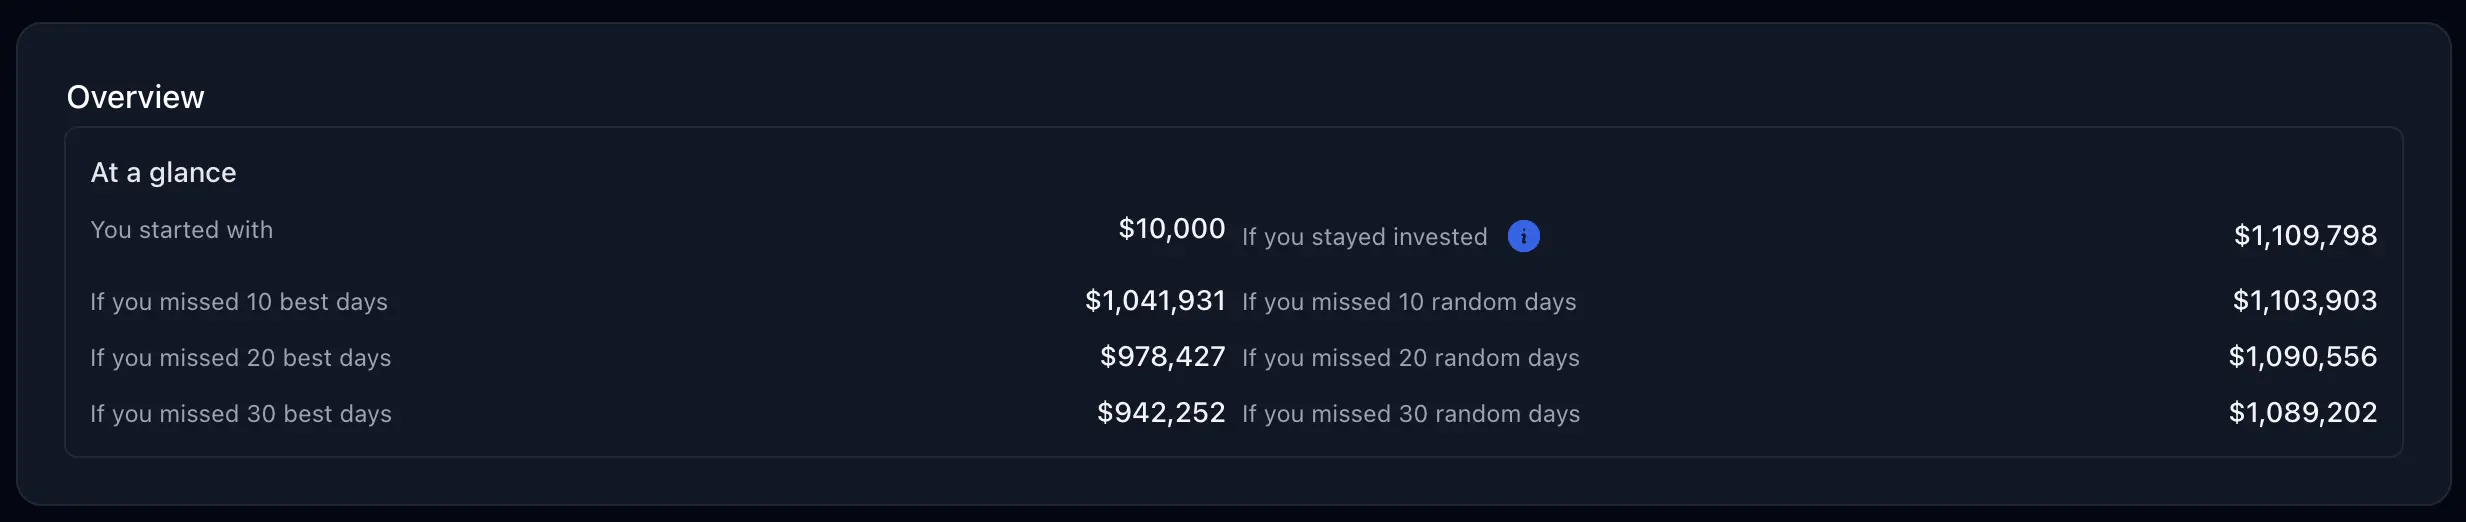
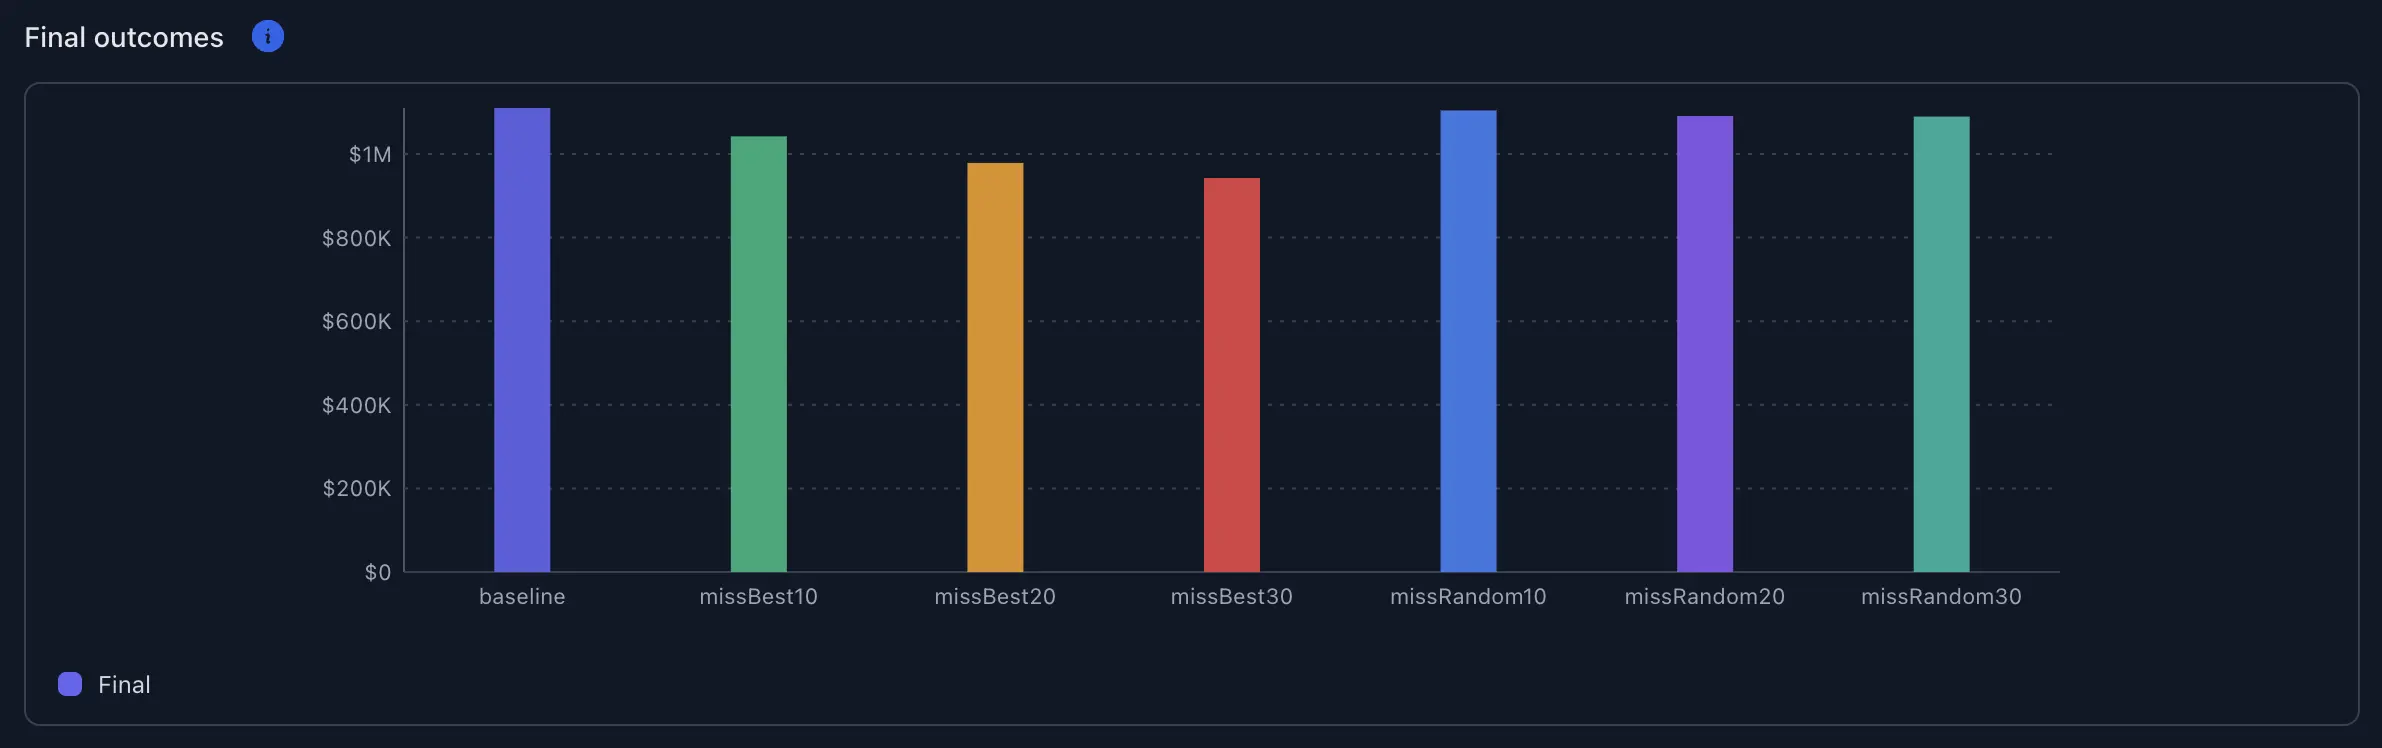
At a glance: the QQQ results
You can see this in the overview card. I pulled the numbers into a table so it’s easy to compare.
| Scenario (20y, QQQ, $10k start, $500/mo) | Ending balance | Shortfall vs. “Stay invested” |
|---|---|---|
| Stay invested | $1,109,798 | — |
| Miss 10 best days | $1,041,931 | −$67,867 (−6.1%) |
| Miss 20 best days | $978,427 | −$131,371 (−11.8%) |
| Miss 30 best days | $942,252 | −$167,546 (−15.1%) |
| Miss 10 random days | $1,103,903 | −$5,895 (−0.5%) |
| Miss 20 random days | $1,090,556 | −$19,242 (−1.7%) |
| Miss 30 random days | $1,089,202 | −$20,596 (−1.9%) |
What jumps out. I put in $130k over twenty years and ended near $1.11M by just staying in. Missing only 10 of the best days shaved off $67,867. Missing 30 best days lopped off $167,546—that’s more than my entire initial $10k + half the contributions. Random missed days? Mostly noise. It’s the best days that matter.
How the calculator does the math (in human terms)
- It pulls daily total-return data (dividends included).
- It finds the top N up-days in your window (that’s the “best days” list).
- If you chose “miss N,” it replaces those day returns with 0% (you were in cash).
- Every day: it applies contributions at open, compounds the day’s return, then handles withdrawals at close (you can switch that).
- It does that across the whole window, then totals up your end value and the basic KPIs.
That’s it. No magic—just consistent, transparent compounding.
A tiny sanity check (toy math, 10 days)
This is just to explain the idea, not to match QQQ.
| Step | Amount | Why it matters |
|---|---|---|
| Start | $1,000 | Base amount |
| Stay invested (10 days mixed) | $1,054.10 | All days counted |
| Miss 2 best days (0% those days) | $984.03 | You skipped the big boosters |
| Shortfall | $70.06 (−6.6%) | Two days in ten did all the damage |
Mini sensitivity: If cash earned 1%/yr while out, that miss-2 result moves by $0.08. Rounding error.
What actually moves the needle (from this QQQ run)
| Lever | Why it matters | Before → After | What I’d do |
|---|---|---|---|
| Missed best days | Deletes the biggest jumps | Miss 10 → −$67,867; Miss 30 → −$167,546 | Don’t time entries/exits |
| Contribution timing | Earlier dollars compound longer | End-of-month → Open | If you can, contribute at open |
| Window length | More time = more clustered big days | 10y → 20y | Use 15–20y for signal over noise |
| Dividends mode | Dividends are real | Price-only → Total return | Always use total return |
| Fees | Small % over years is real cash | 0 bps → your ER | Prefer low-fee funds |
| Inflation view | Keeps expectations honest | Nominal → Real | Toggle to see purchasing power |
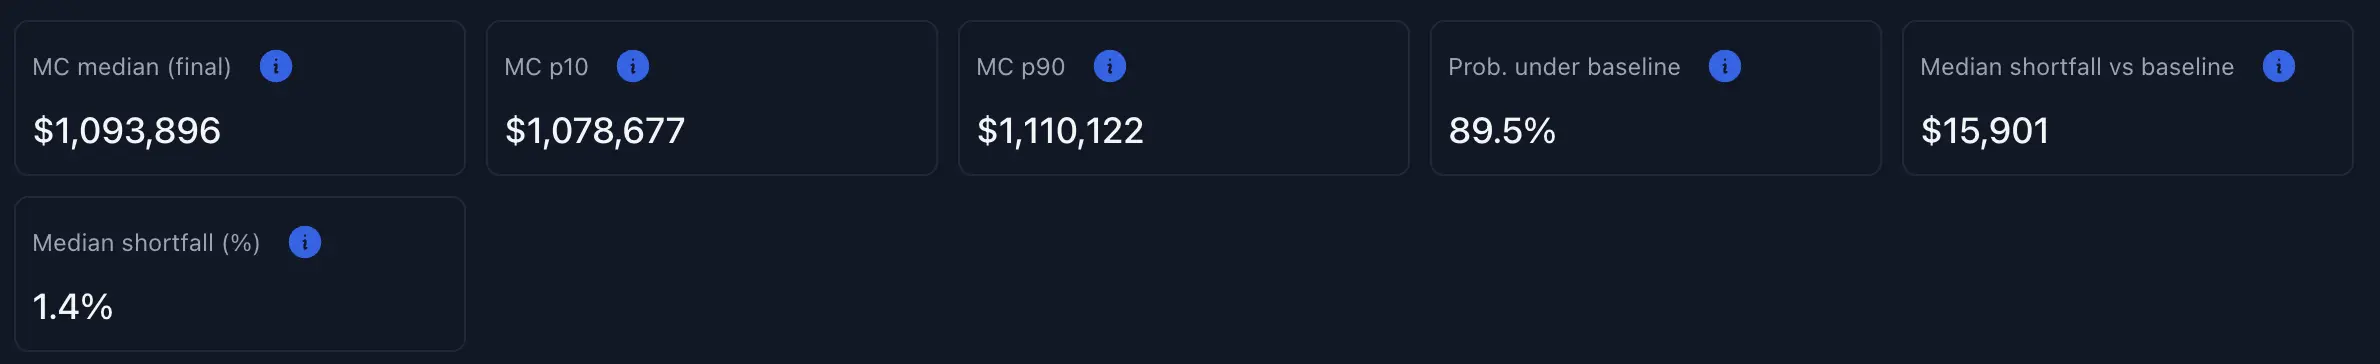
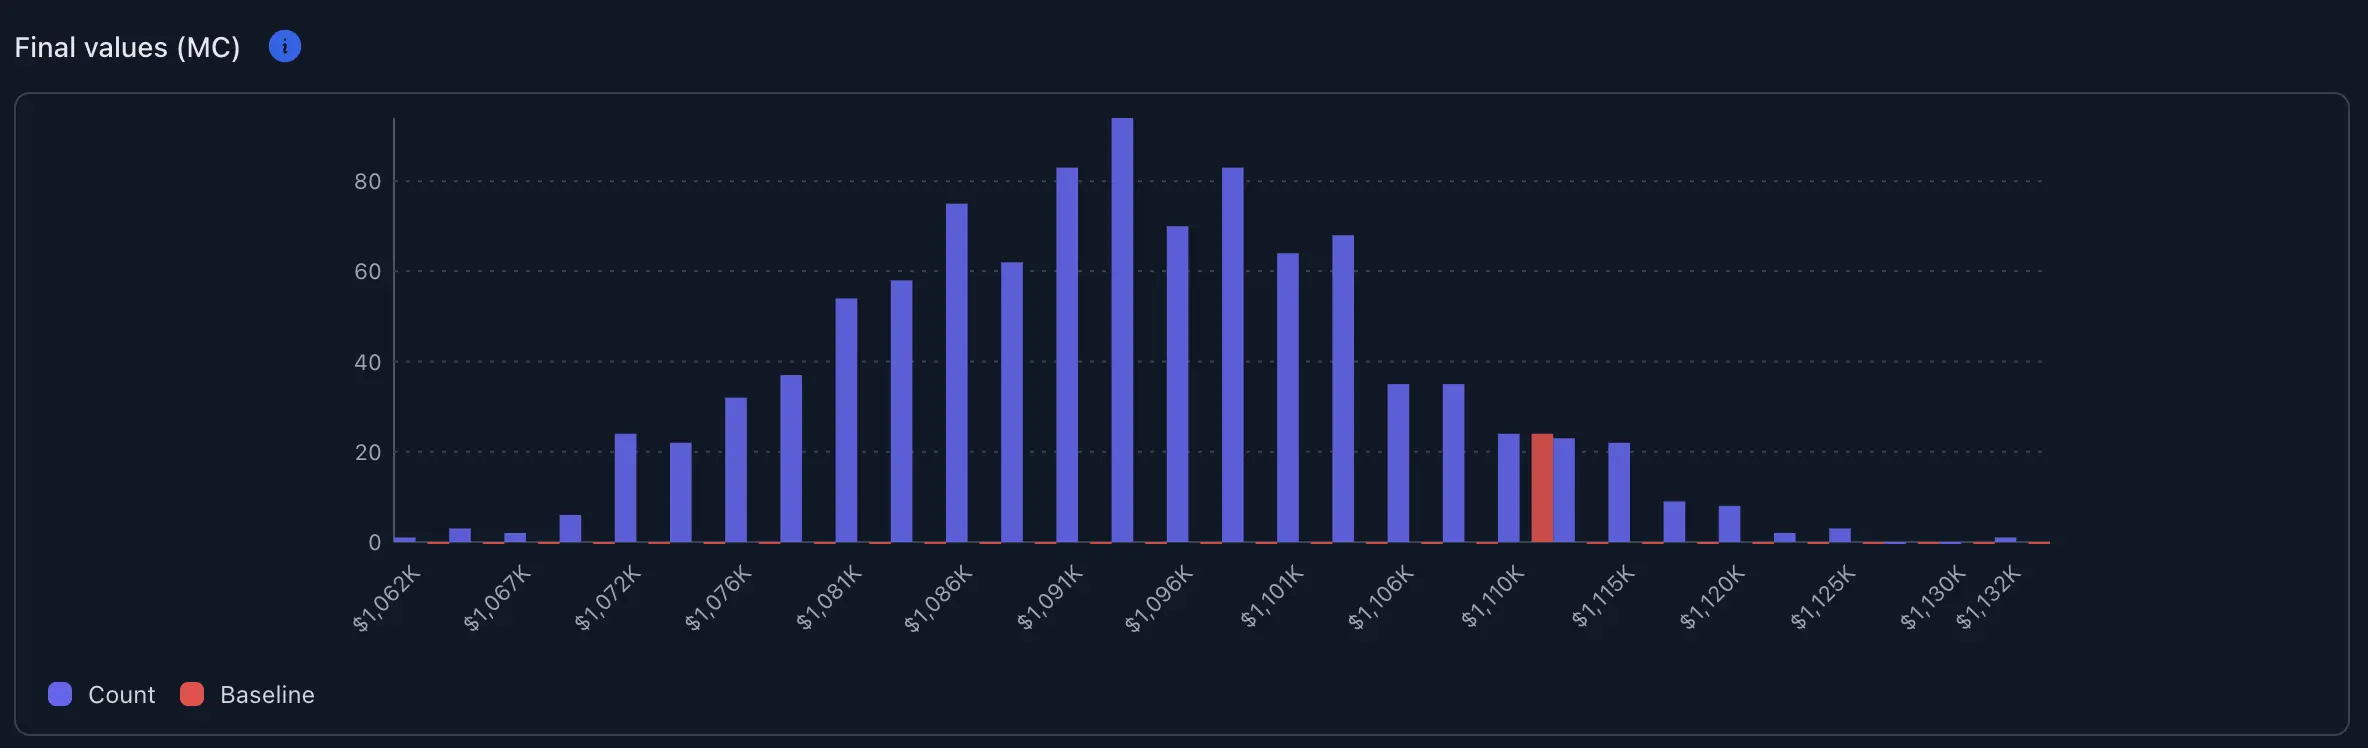
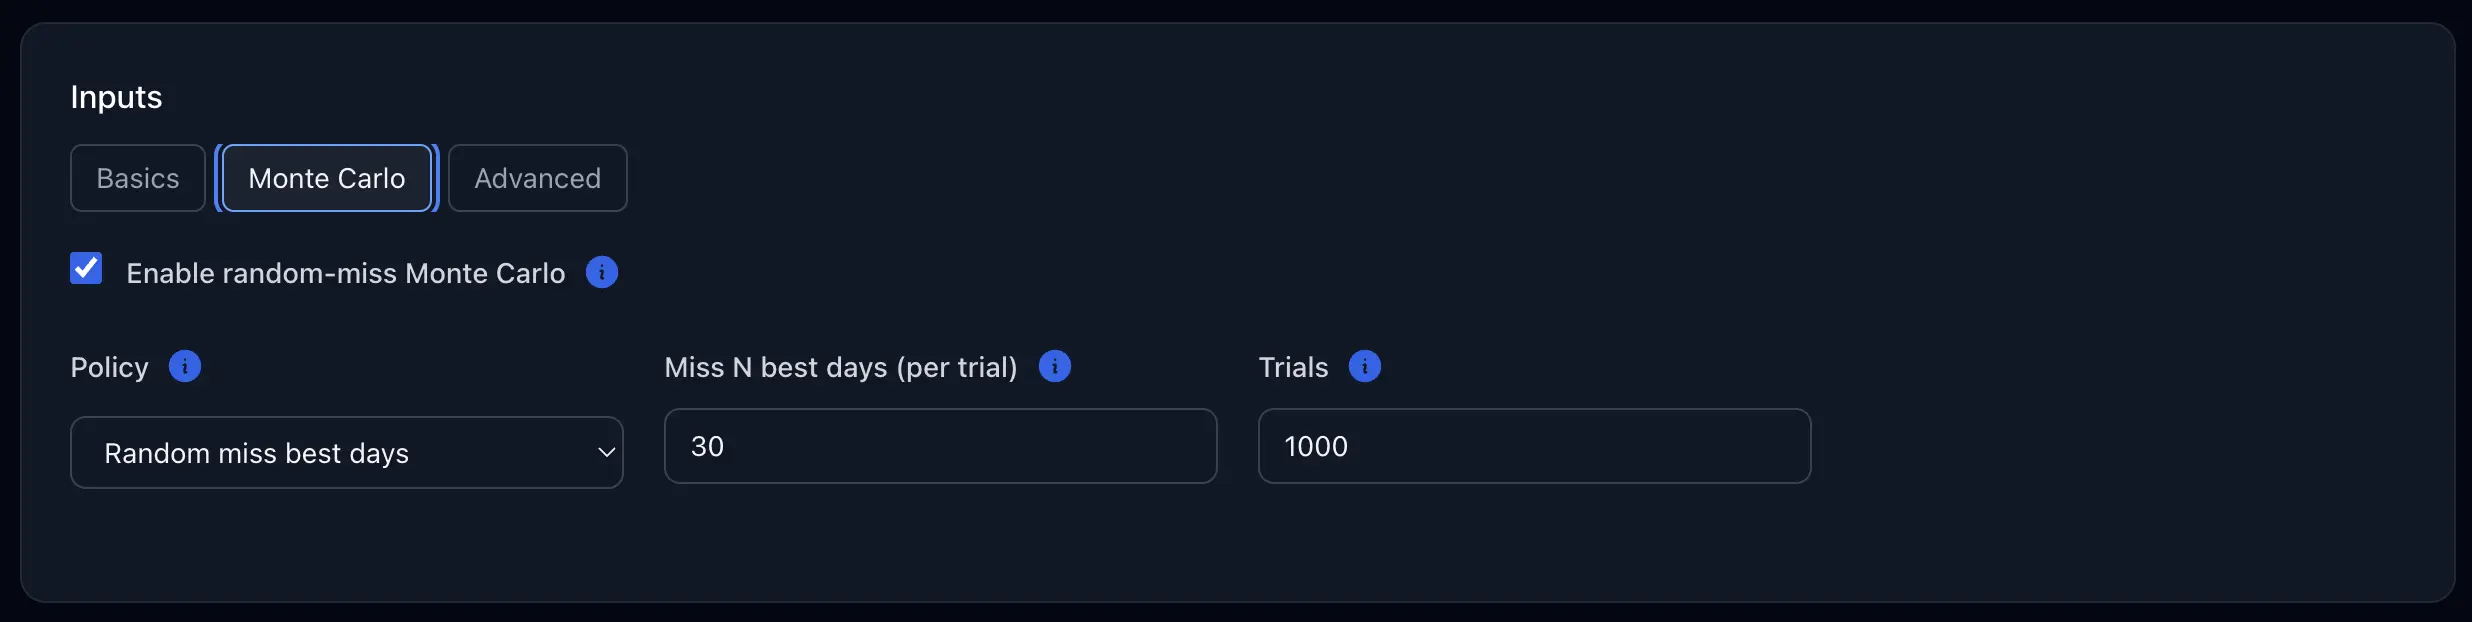
Monte Carlo: “what if I randomly miss days?”
This panel asks, “What typically happens if I miss 30 random days (not cherry-picked)?” It runs 1,000 trials and summarizes.
| Metric | Value | Why it matters |
|---|---|---|
| Median (final) | $1,094,466 | Typical random-miss ending |
| p10 / p90 | $1,079,910 / $1,109,603 | Most random-miss outcomes live here |
| Prob. under baseline | 90.4% | Random missing usually trails “stay in” |
| Median shortfall vs baseline | $15,332 (−1.4%) | Typical drag from random missing |
Plain English: even when misses are random, you’re still behind most of the time. The edge comes from simply being there for the handful of rip-your-face-off up days.
Quick screeners (so you don’t overfit)
| Rule | What it means | How I use it | Common fail |
|---|---|---|---|
| Prove it on defaults | Start with S&P 500 TR or QQQ, 20y | Sanity-check before tweaking | Curve-fitting a niche period |
| Keep cash at 0% | Out-of-market earns little | Be honest about cash | Giving cash equity-like returns |
| Show 10/20/30 side-by-side | Standard views readers expect | Makes the point fast | Only showing the “best” case |
| Use total return | Dividends included | Default on | Understating growth by ignoring them |
Side-by-side: timing vs. staying in
| Dimension | Try to time it | Stay invested |
|---|---|---|
| Hassle | High (constant decisions) | Low (automate, rebalance) |
| Costs/taxes | Often higher | Lower |
| Results (typical) | Trails if you miss best days | Captures best days by default |
| Fit | Traders with a tested system | Most long-term savers |
My rule of thumb: if I want to “do something,” I adjust allocation (e.g., more bonds), not timing. And if I must tinker, I keep it to ≤10% “fun money” so the core keeps compounding.
Glossary (no jargon left behind)
| Term | Plain definition | Why it matters |
|---|---|---|
| Total return | Price change plus dividends | Realistic growth |
| Best days | Highest single-day gains | Missing these does the damage |
| Basis points (bps) | 1 bp = 0.01% | How fees are quoted |
| CPI / Real | Inflation-adjusted dollars | Your buying power |
| OPEN vs. CLOSE | When contributions hit a day | Changes compounding base |
| Monte Carlo | Many random trials | Shows typical vs. tail outcomes |
Checklist (do this next)
- Open fiscademy.com/calculator/stay-invested.
- Set QQQ, 20 years, $10,000 start, $500/month at OPEN.
- Keep Total return ON, Out-of-market = 0%, fees at your fund’s ER.
- Run 10/20/30 best-day misses side-by-side; read the shortfall column.
- Toggle random miss (30 days, 1,000 trials) to see typical lag.
- Flip Inflation to Real (CPI) for a purchasing-power check.
- If you’re tempted to time, lower risk by changing allocation, not timing.
- Save your table and pin it where you actually make money decisions.